Streamlit
This is the documentation for “HADO_CARES” hado_app 😊
You can access the HADO CARES application here: https://hado-cares.streamlit.app/
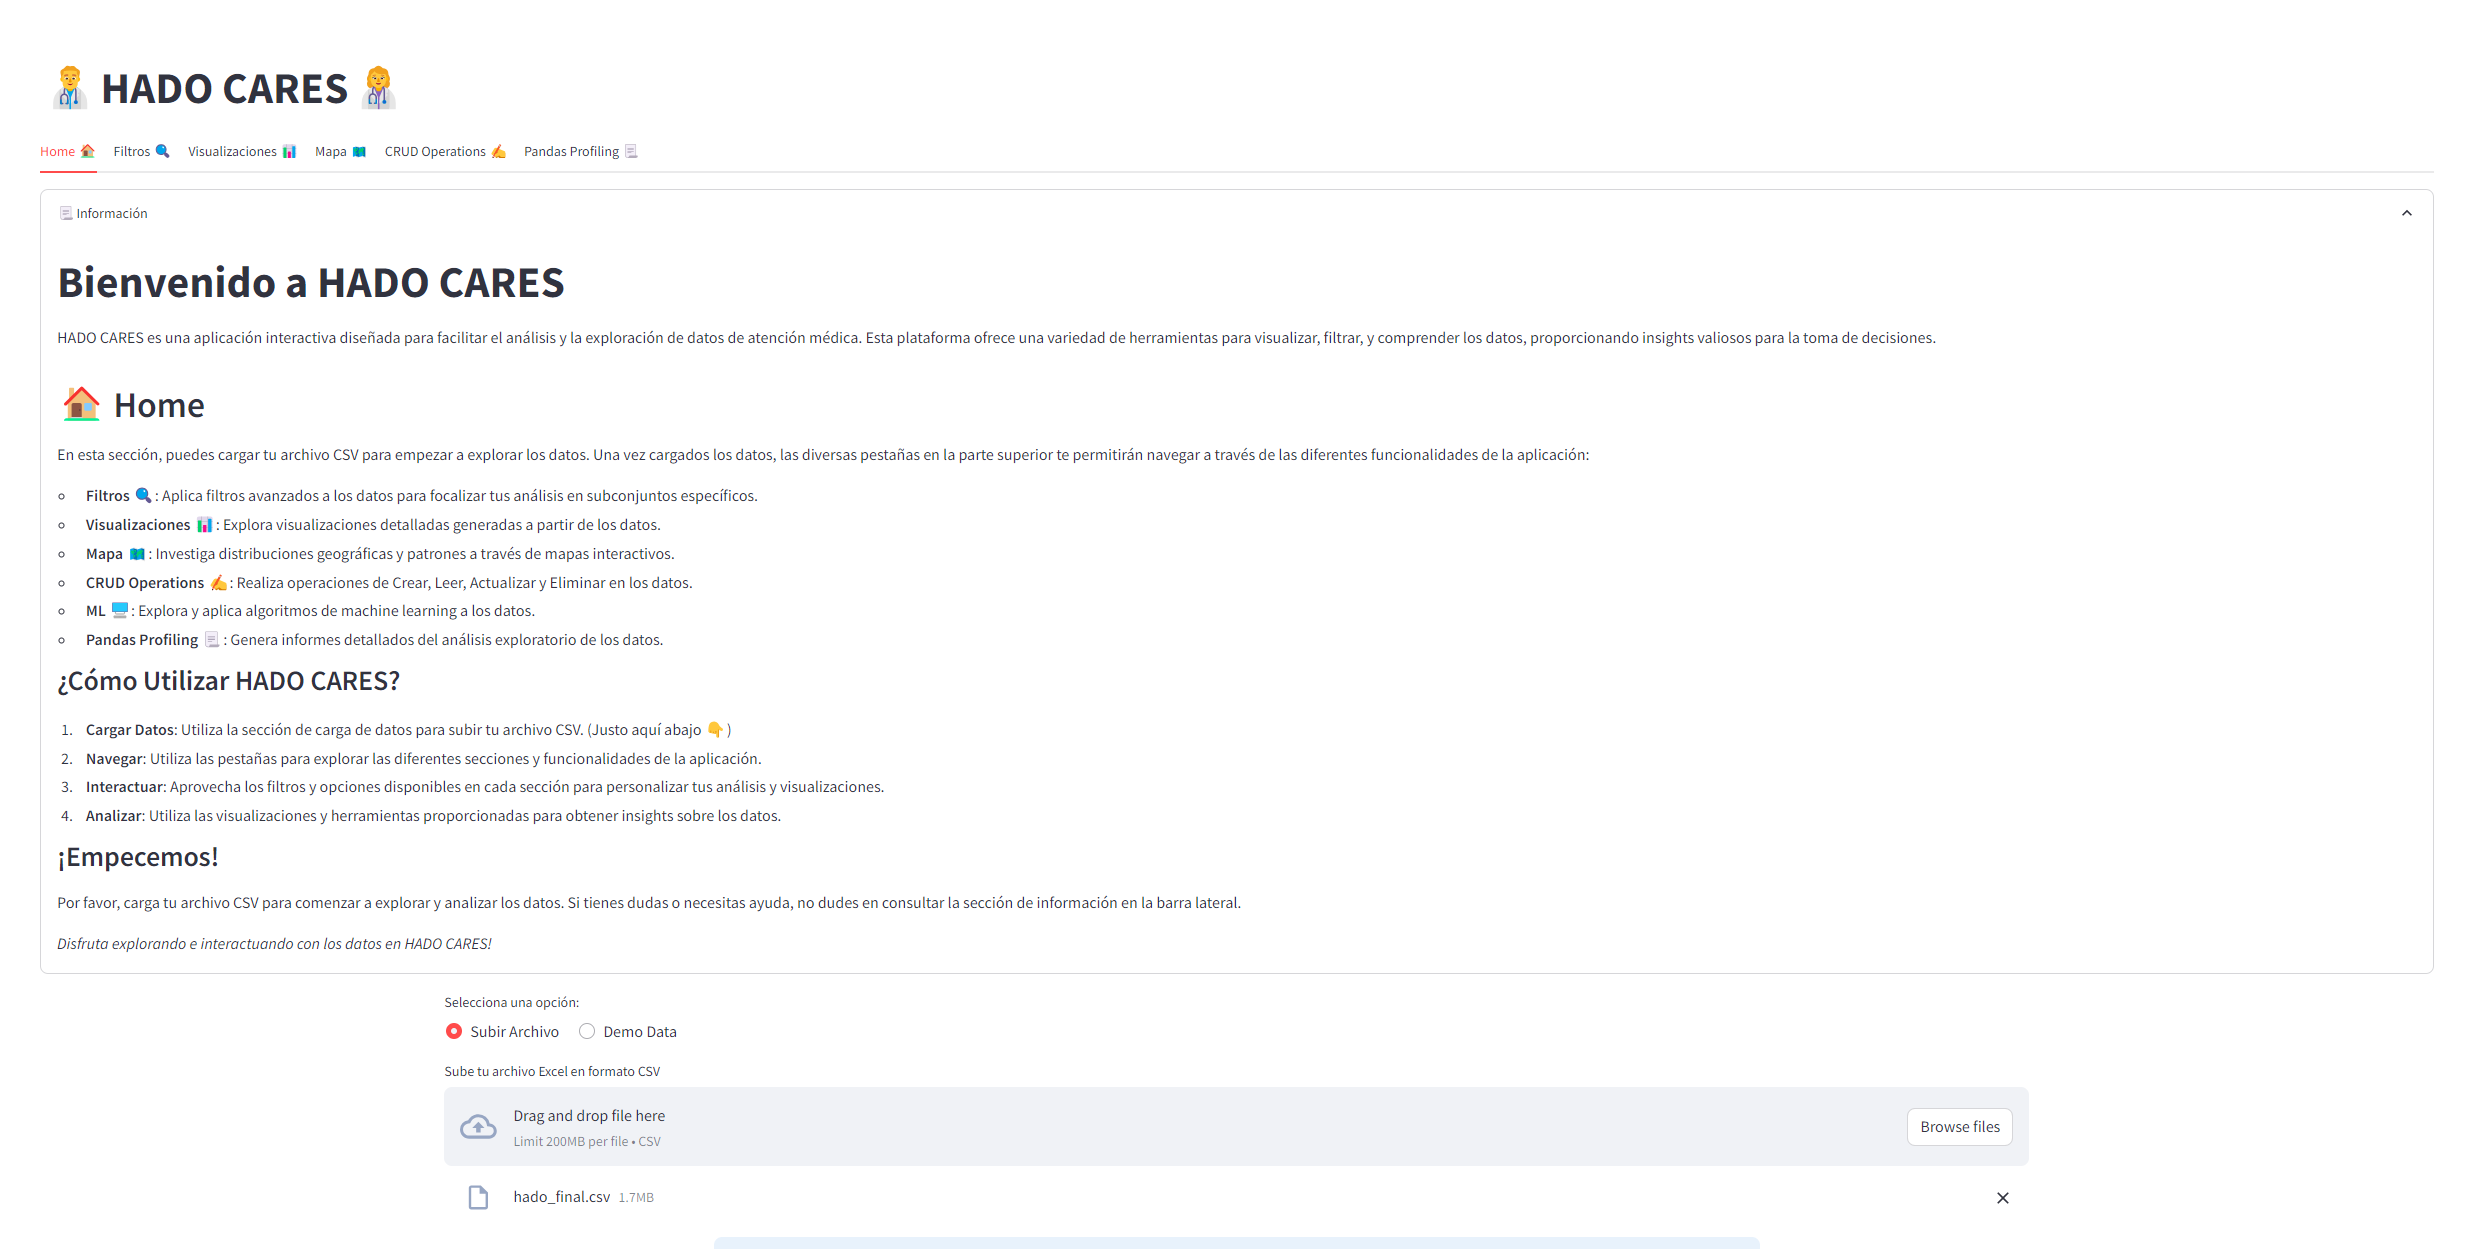
Home:
Other resources:

Overview
HADO_CARES is a Streamlit application designed to help HADO department from Spain located at Santiago de Compostela. This documentation will guide you through each module and functionality embedded within the application.
Prerequisites
Before you get started, you’re going to need a few things:
Your favorite IDE or text editor
Python 3.8 - Python 3.11
PIP
In this case for this app you will need Python 3.10
Getting Started
To install and run the HADO_CARES Streamlit application, ensure you have met the prerequisites and follow the steps below:
Step 1: Clone the Repository
Clone the HADO_CARES repository from GitHub to your local machine.
git clone https://github.com/pablovdcf/TFM_HADO_Cares.git
Navigate to the project directory.
cd TFM_HADO_Cares\hado
Step 2: Set Up a Virtual Environment
It’s recommended to create a virtual environment to manage dependencies.
python -m venv venv
source .\venv\Scripts\activate  # If you are not using Windows use `venv/bin/activate`
Step 3: Install Dependencies
Install the required packages using pip.
pip install -r requirements.txt
Step 4: Run the Streamlit Application
Once the dependencies are installed, you can run the Streamlit application.
streamlit run hado_app/app.py
The application should now be running and accessible in your web browser at http://localhost:8501.
Aditional Notes
Clone the Repository: Make sure you have Git installed to clone the repository.
Virtual Environment: Creating a virtual environment is a good practice to manage dependencies in isolation.
Install Dependencies: requirements.txt should list all the dependencies needed to run the application.
Run Streamlit: Make sure Streamlit is installed and run the application with the provided command.
Data Processing Module
The provided suite encompasses a series of functions designed to streamline the data processing and data loading processes within a Streamlit application. Initially, the necessary modules and libraries such as Streamlit, Pandas, ydata_profiling, GeoPandas, and others are imported to ensure the availability of required functionalities.
Loading Data
load_csv_home_expander allows for the loading of CSV files while providing a summary of the loaded data along with basic statistics and data distribution insights.
sidebar_and_upload handles file upload operations, displaying a sidebar for user interaction and leveraging Streamlit’s caching mechanism to optimize performance.
Data Filtering
apply_filters facilitates interactive data filtering based on various criteria such as year, council, patient status, and others, enabling users to narrow down the data to their specific areas of interest.
CRUD Operations
crud_operations provides a structured interface for performing Create, Read, Update, and Delete (CRUD) operations on the data, empowering users to not only view but also modify the data interactively.
Data Profiling
generate_pandas_profiling enables the generation of detailed Pandas Profiling reports from an uploaded file, aiding in the explorative analysis of the data.
Geographic Data Handling
load_gdf simplifies the loading and cleaning of GeoDataFrames from remote geojson files, ensuring the data is apt for further geographic analysis.
Additional Notes
Each function is meticulously documented, ensuring clarity on the parameters required and the operations performed, thus promoting ease of understanding and extendibility. The diverse functionalities encapsulated within these functions contribute towards a robust and interactive data processing and management framework within a Streamlit application.
Data Test Module
This module provides functions to generate synthetic test data that simulates a dataset within a healthcare domain.
Functions
Function Details
generate_data
The generate_data function produces synthetic data with various attributes, aiming to simulate a dataset within a healthcare domain. This function generates random data for a specified number of entries (n). The produced data mimics a realistic healthcare dataset, with multiple attributes regarding patient, hospital, and treatment information. NumPy’s random choice functionality is used to generate random values for each attribute. The function also defines classifications for certain attributes based on their generated numerical values and encapsulates all the generated data into a Pandas DataFrame, which is then returned.
Here is a brief overview of some of the attributes that are generated:
Hospital Information: Data such as the name of the hospital and service origin.
Diagnosis and Admission: Including categories of diagnosis and reasons for admission and discharge.
Geographic Information: Such as the municipality of origin of the patients.
Quantitative Variables: Such as the number of stays, visits, and evaluative scores.
Classifications: For certain numerical values, classifications are predefined, such as classifications for GDS Fast, Barthel, and PS ECOG scores.
Example Usage
import pandas as pd
import numpy as np

def generate_data(n):
   # Generating random data for each of the numerical columns
   gds_fast = np.random.randint(0, 7, n)
   barthel = np.random.randint(0,100, n)
   ps_ecog = np.random.randint(0, 4, n)

   hospital = np.random.choice(['Santiago', 'Coruña', 'Vigo', 'Ponetvedra', 'Ourense', 'Lugo', 'Barbanza'], n)
   servicio_procedencia = np.random.choice(['Unidad Paliativos', 'Oncologia', 'MIR', 'Digestivo', 'Urgencias', 'Otros',
                                          'Hematologia', 'Neumologia', 'Cardiologia', 'Neurologia'], n)
   diagnostico_categoría = np.random.choice(['Canceres y neoplasias', 'Neurologicas', 'Hepaticas y pancreaticas',
                                             'Hematologicas', 'Pulmonares y respiratorias', 'Otros',
                                             'Renales y urinarias', 'Infecciones', 'Musculoesqueléticas y de piel',
                                             'Cardiacas'
                                             ], n)
   ingreso_categoría = np.random.choice(['Sintomas', 'Evaluaciones', 'Otros', 'Tratamientos'], n)
   atencion_primaria = np.random.choice(['no', 'si'], n)
   numero_estancias = np.random.randint(0, 305, n)
   numero_visitas = np.random.randint(0, 100, n)

   # Defining the corresponding classifications
   gds_fast_classification = [
     ['No realizado o desconocido', 'Deficit cognitivo muy leve', 'Deficit cognitivo leve',
      'Deficit cognitivo moderado', 'Deficit cognitivo moderadamente grave', 'Deficit cognitivo grave',
      'Deficit cognitivo muy grave', 'Ausencia de deficit cognitivo'][i] for i in gds_fast]

   barthel_classification = [
     ['Dependencia total', 'Dependencia severa', 'Dependencia moderada', 'Dependencia leve o minima', 'Independencia'][
                  0 if i < 20 else 1 if i < 40 else 2 if i < 60 else 3 if i < 90 else 4] for i in barthel]

   ps_ecog_classification = [
     ['Totalmente asintomatico', 'Sintomas leves', 'Sintomas moderados',
      'Necesita ayuda para la mayoria de actividades', 'Encamado el 100%'][i] for i in ps_ecog]

   # Creating the DataFrame
   data = pd.DataFrame({
     "hospital": hospital,
     "servicio_procedencia": servicio_procedencia,
     "diagnostico_categoría": diagnostico_categoría,
     "ingreso_categoría":ingreso_categoría,
     'atencion_primaria': atencion_primaria,
     'n_estancias': numero_estancias.astype('int64'),
     'n_visitas': numero_visitas.astype('int64'),
     'eva_ing': eva_ing.astype('int64'),
     'ayuntamiento': ayuntamiento,
     'year': year,
     'gds_fast': gds_fast.astype('int64'),
     'gds_fast_classification': gds_fast_classification,
     'barthel': barthel.astype('int64'),
     'barthel_classification': barthel_classification,
     'ps_ecog': ps_ecog.astype('int64'),
     'ps_ecog_classification': ps_ecog_classification,
     })

   return data

 # Example usage:
 df = generate_data(100)
Interactive Maps Module
The module under consideration encapsulates a set of functions aimed at rendering interactive maps within a Streamlit application, utilizing data visualization libraries like Folium and data analysis libraries like Pandas. The necessary modules and libraries, including Streamlit, Folium, Matplotlib, and Seaborn, are imported to unlock the functionalities essential for map generation and data visualization.
Rendering Maps
folium_static takes a Folium map object and renders it within a Streamlit application, ensuring the interactive capabilities of the map are retained in the web app interface.
Interactive Map Generation
generate_interactive_maps dynamically generates interactive maps based on provided data and parameters, offering a visual representation of data distributions across geographical locations.
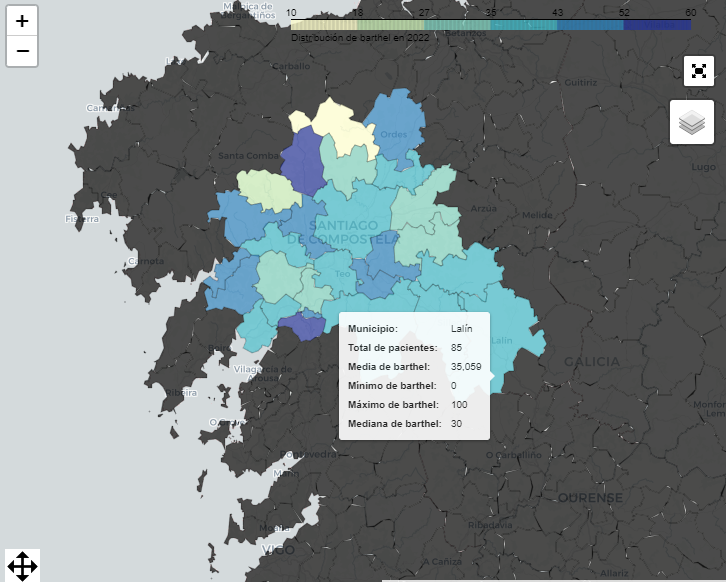
Visualizing Patient Data by Municipality
plot_patients_by_ayuntamiento visualizes the number of patients per municipality, offering insights into the geographical distribution of patient data.

Visualizing Average Metrics by Municipality
plot_average_metrics_by_ayuntamiento generates visualizations that convey average metrics, providing a bird’s-eye view of various key performance indicators across municipalities.

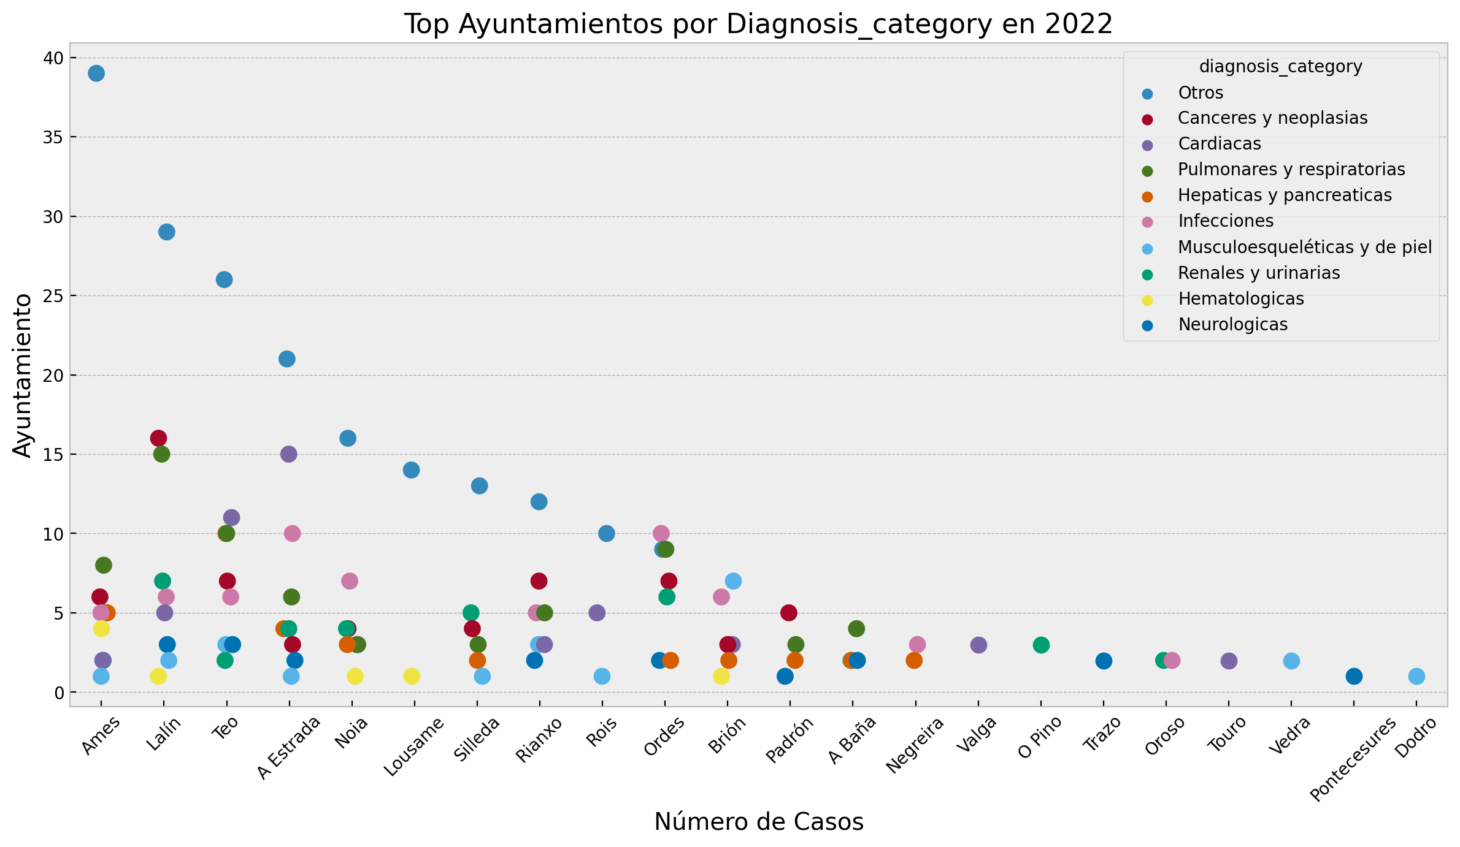
Visualizing Top Municipalities for Selected Categories
plot_top_ayuntamientos_for_category visualizes the top-performing municipalities for selected categories, facilitating comparative analysis across geographical locales.
Bar chart:

Bubble chart:
Additional Notes
Each function within the module is documented, providing comprehensive details regarding the expected parameters and the underlying functionality, thereby ensuring that the module can be effectively utilized or expanded upon by other developers. The functions collectively offer a robust framework for generating a variety of interactive visualizations and maps within a Streamlit application, providing a visually intuitive method to explore and interpret geographical data distributions and trends.
Visualization Functions Module
This module encompasses a series of functions dedicated to generating various types of visualizations to explore and present the data interactively through a Streamlit application. It utilizes libraries such as Matplotlib, Seaborn, Plotly, and WordCloud to render diverse charts and plots, aiding in the detailed and comprehensive exploratory data analysis.
Bar and Line Plots
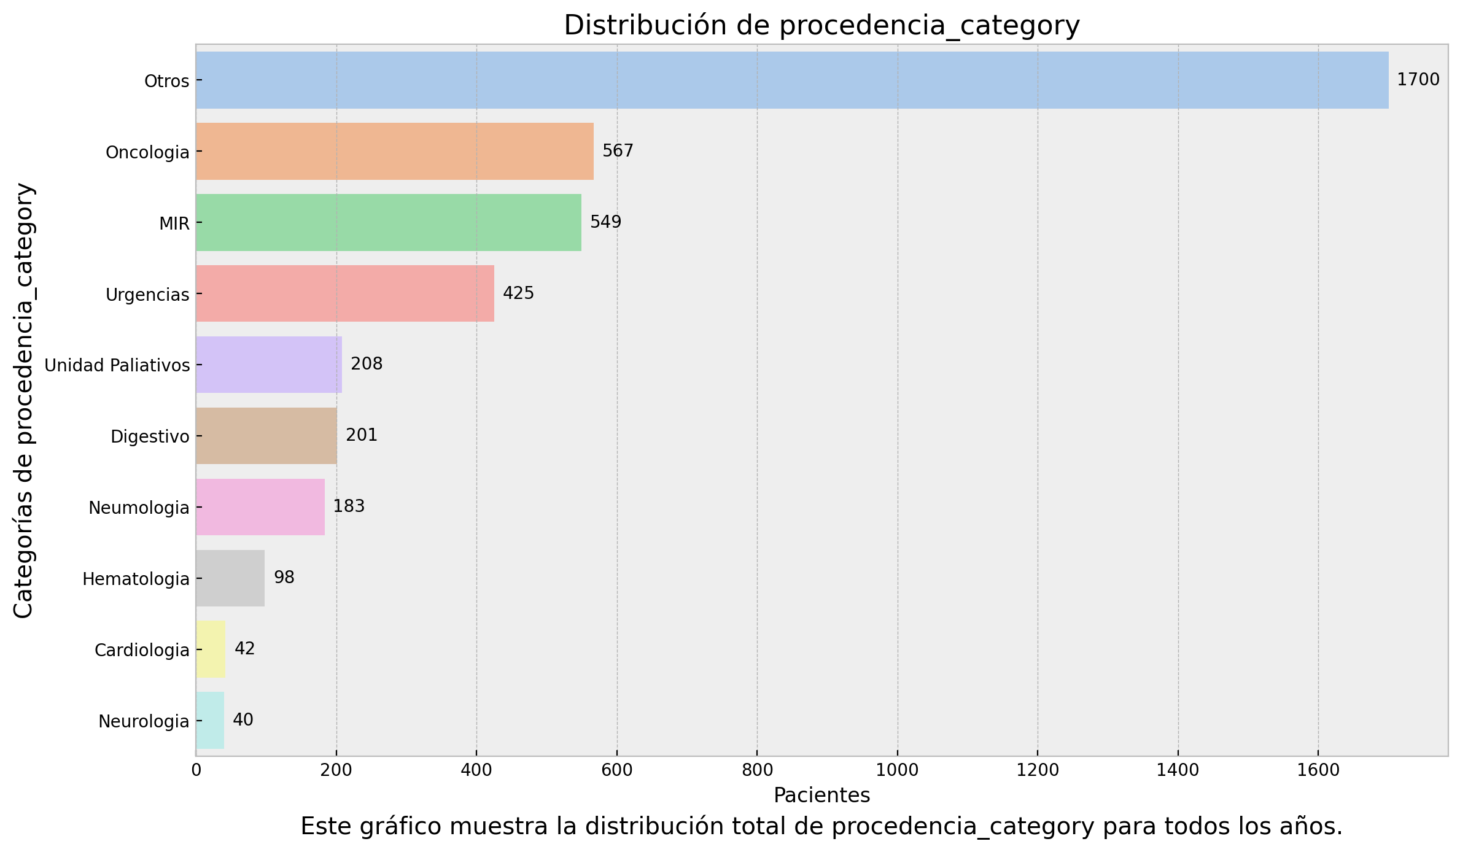
- plot_selected_category
Generates a bar plot showcasing the distribution of a selected categorical column. Provides insights into the frequency of different categories within a specific column.
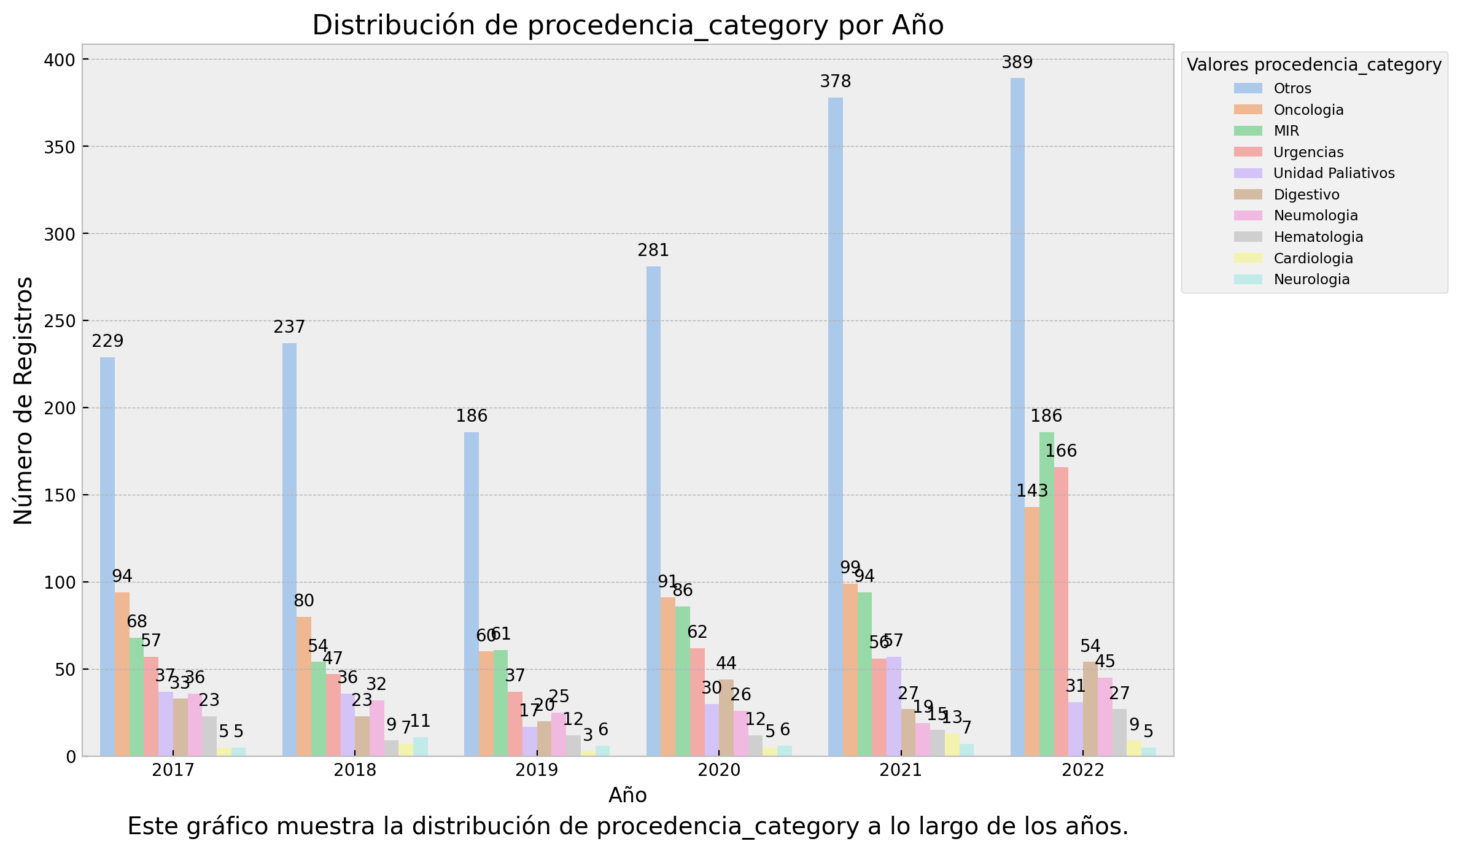
- plot_time_trends
Visualizes the distribution of a selected categorical column over multiple years, enabling users to perceive trends and variations across different time periods.
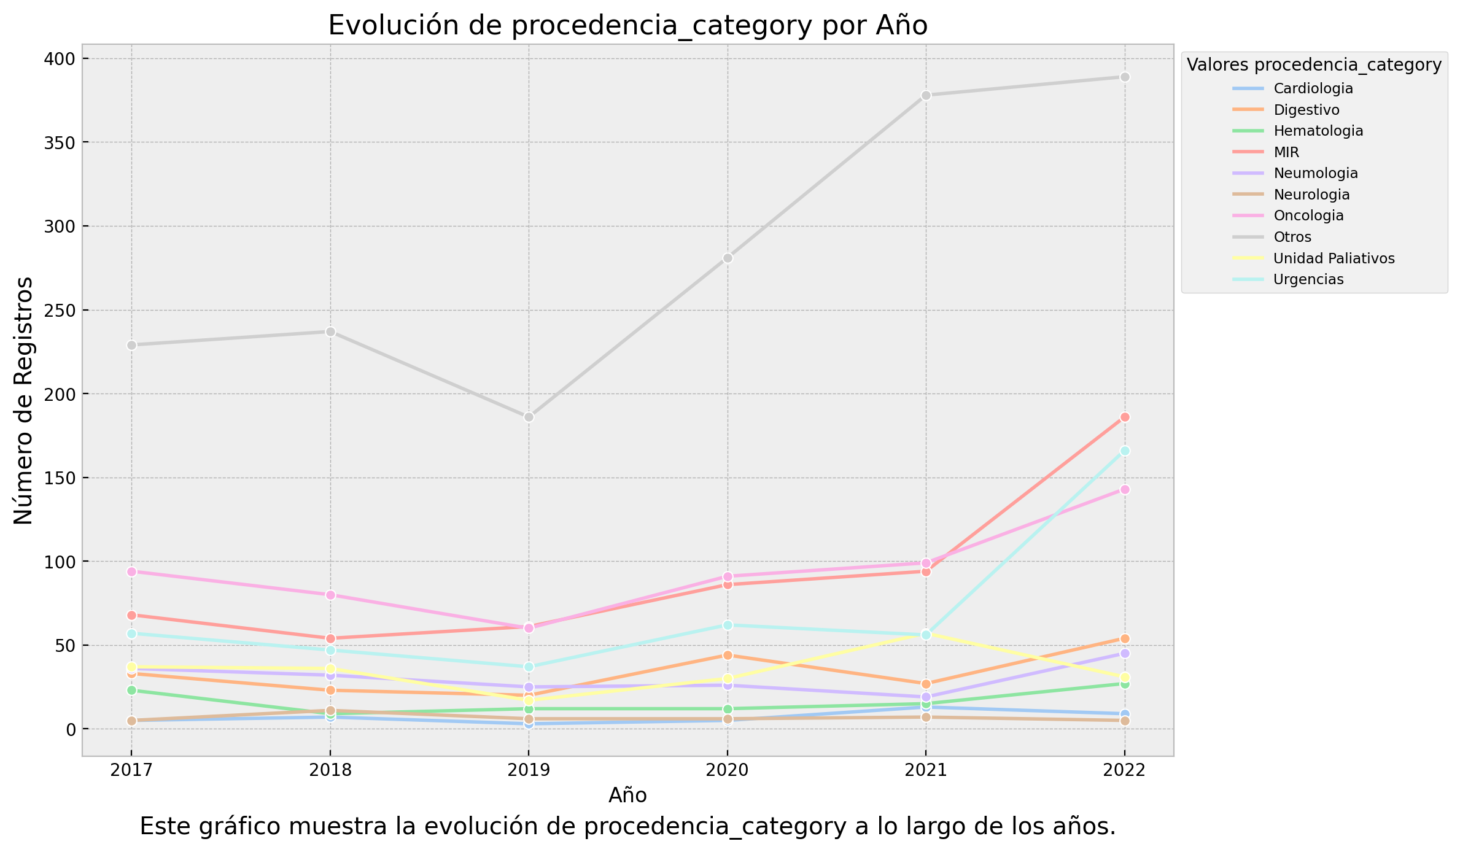
- plot_time_trends_line
Illustrates the evolution of a selected categorical column over the years through a line plot, granting a clear view of the changes and developments across time.
Heatmaps
- plot_classification_heatmap
Presents a heatmap, providing a vivid representation of the distribution of scores for each classification, offering a clear, color-coded visualization of data distributions.

- plot_heatmap
Deploys two heatmaps displaying relationships between two selected columns, one in percentages and the other in absolute values, providing dual perspectives on the data relationships.

Bubble Charts
- plot_bubble_chart
Produces a bubble chart, visualizing the relationship between three or four variables and allowing users to comprehend multi-dimensional data easily.

- plot_animated_bubble_chart
Generates an animated bubble chart that dynamically represents the relationship between three or four variables over time, offering an engaging and intuitive understanding of data evolution.

Additional Visualizations
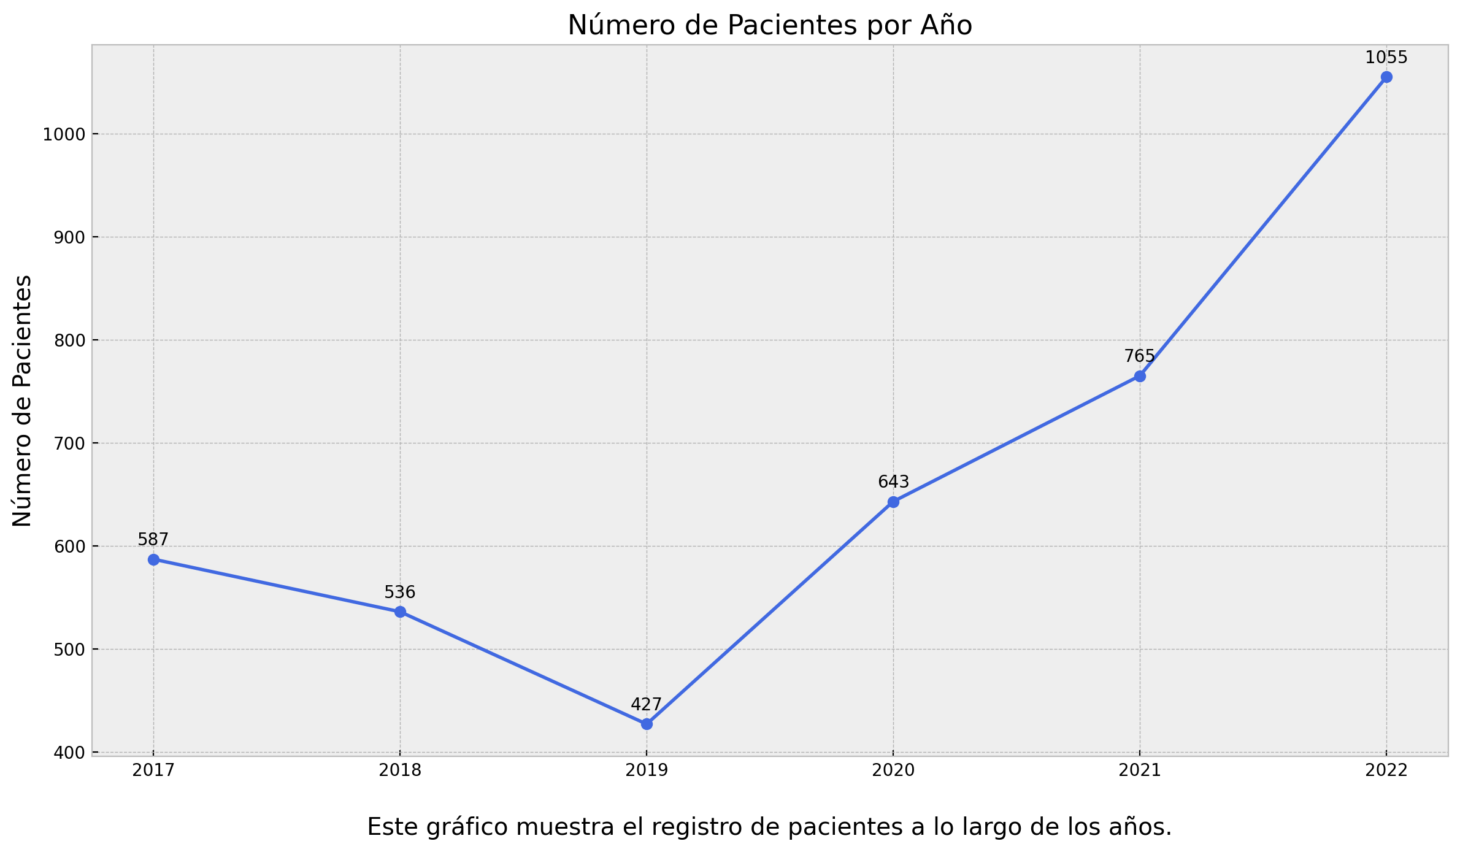
- plot_total_patients
Crafts a line plot depicting the total number of patients per year, providing a straightforward visualization of patient data trends over time.
- wordcloud_or_hist_box_plot
Renders a word cloud for object-type columns or a histogram and a boxplot for numeric columns (int64), offering a flexible method for visualizing both textual and numerical data.
Wordcloud:

Histogram and boxplot:

Additional Notes
Each function is meticulously documented, ensuring clarity on the parameters required and the operations performed, thus promoting ease of understanding and extendibility. The functionalities encapsulated within these functions contribute towards a robust and interactive data visualization framework within a Streamlit application.
Utility Functions Module
The utility functions module contains helper functions designed to improve the user interface and user experience within a Streamlit application. These functions allow developers to add spaces, lines, and informative text to the user interface in a straightforward and efficient manner.
User Interface Enhancements
- ui_spacer
This function allows developers to add empty space within the Streamlit application interface. The function takes two optional arguments: n, which specifies the number of empty lines to add, and line, a boolean that, when true, adds a horizontal line after the empty space.
Information Display
- ui_info
This function displays a welcoming message and informational content to the application’s main page. It provides a brief description, a gratitude message for users’ interest, a disclaimer about the application’s testing status, and a link to the source code repository on GitHub.
Example of Use
import streamlit as st
from hado_app.utils import ui_spacer, ui_info

def main():
    ui_info()
    ui_spacer(n=3, line=True)
    st.title("Welcome to HADO Cares Application")
Additional Notes
These utility functions aim to streamline the development of user interfaces within Streamlit applications by providing quick and easy-to-use methods for adding structured informational content and managing spacing within the app. By employing these utilities, developers can ensure a neat and user-friendly interface while maintaining an organized codebase.